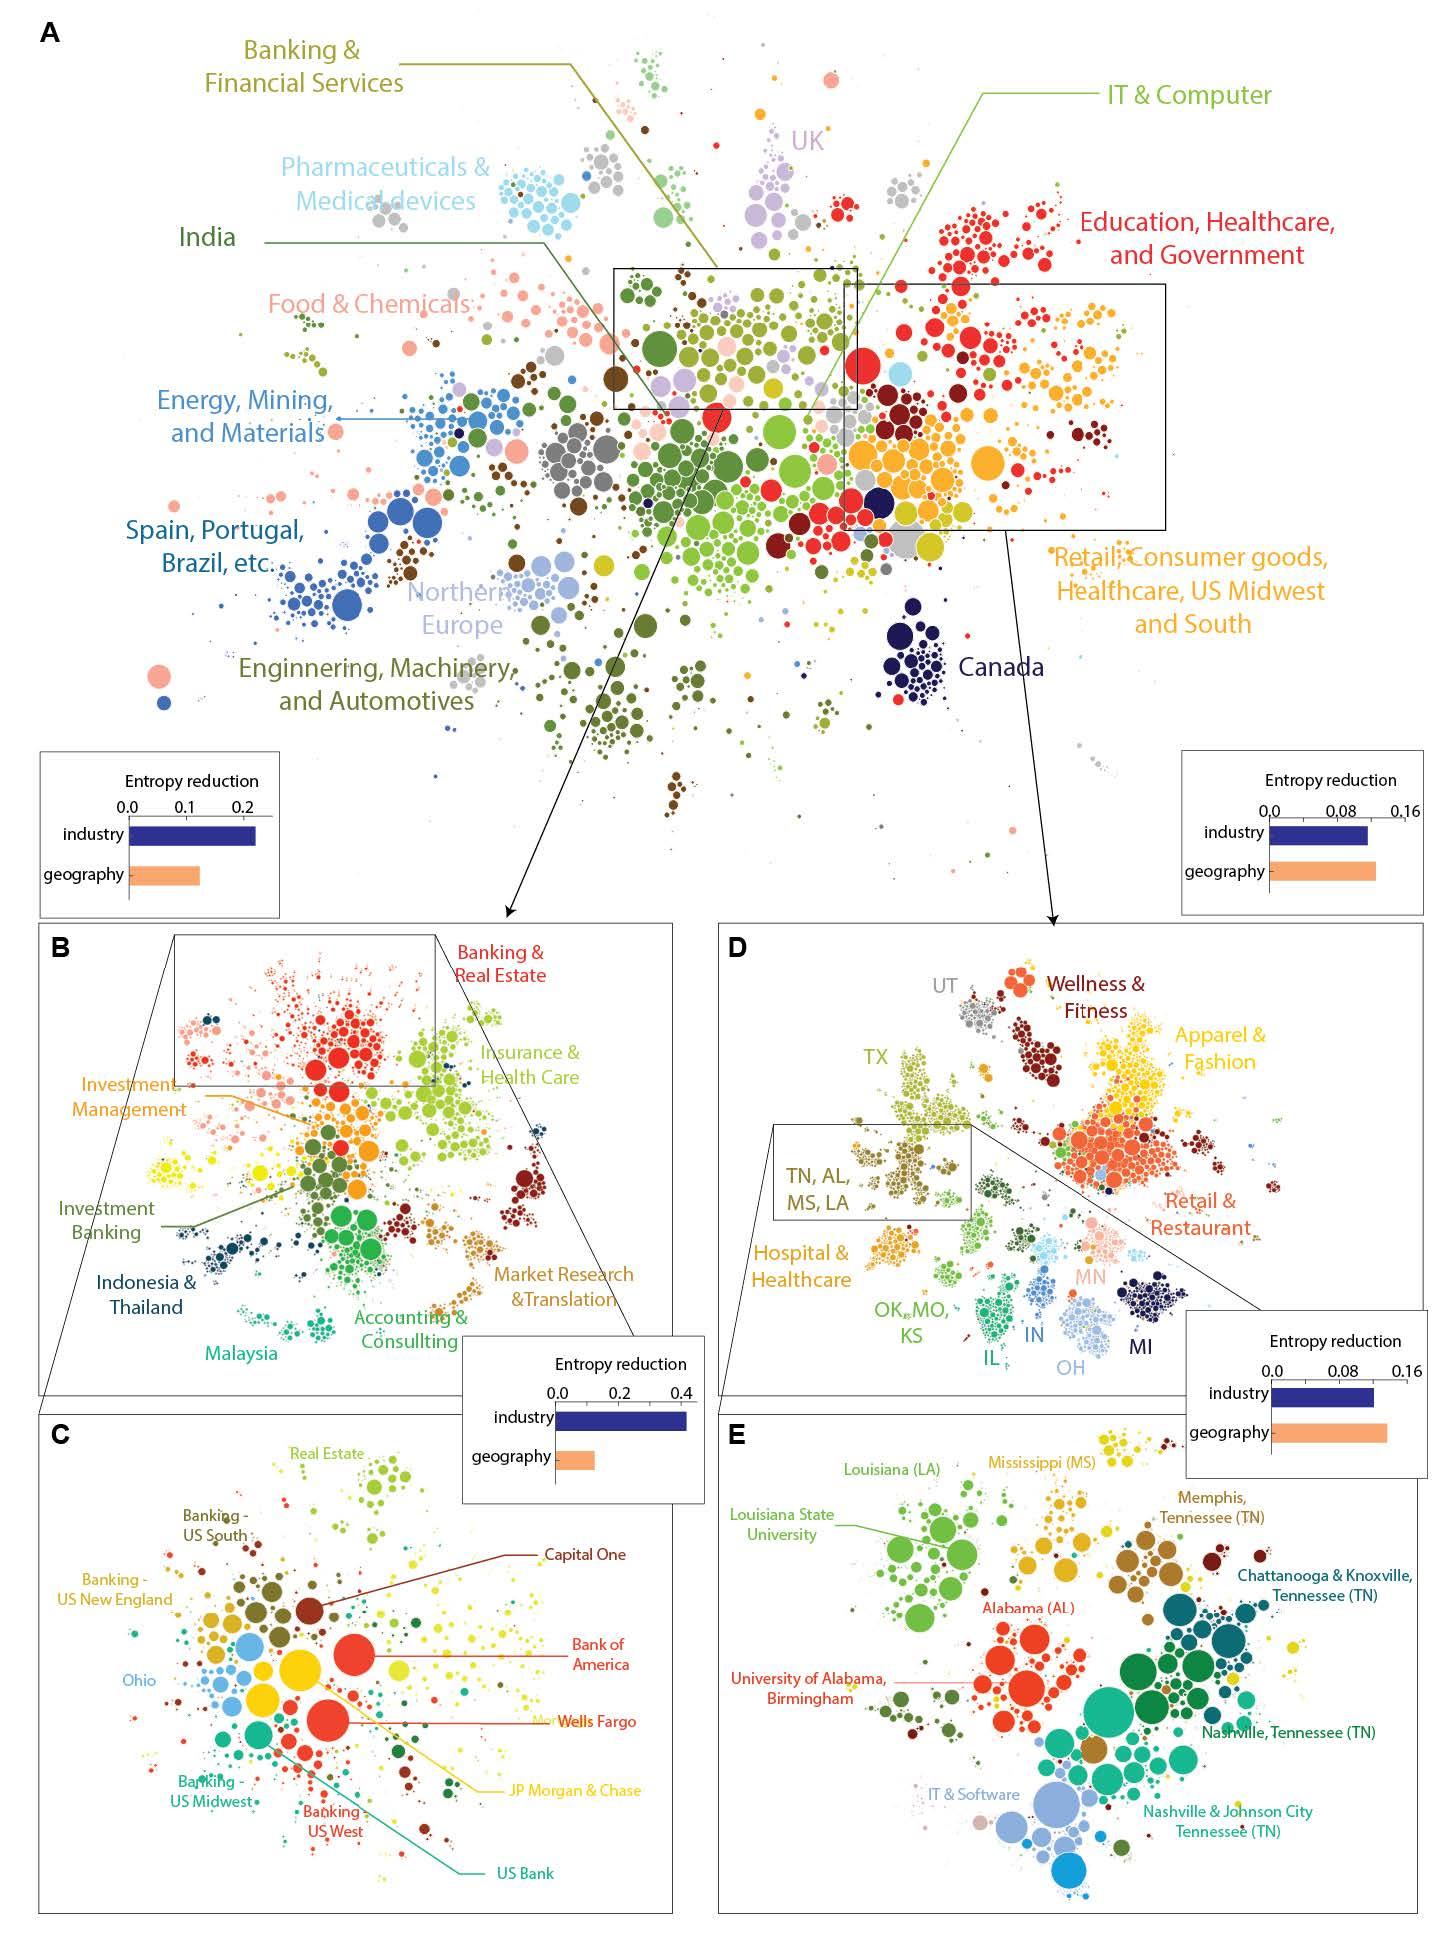
[Infographic] Where Do Engineers Fit it on the Global Labor Flow Map?
A team from Indiana University teamed up with LinkedIn to create the very first global map of labor flow. Labor flow is simply the movement of people transitioning between jobs and firms. The results offer a powerful tool for understanding the flow of people between industries and regions in the U.S. and beyond. It could also help policymakers better understand how to address critical skill gaps in the labor market or connect workers with new opportunities in nearby communities.
The study showed some unexpected connections between economic sectors, such as the strong ties between credit card and airline industries. It also identified growing industries during the study period from 2010 to 2014, including the pharmaceutical and oil and gas industries — with in-demand skills such as team management and project management — as well as declining industries, such as retail and telecommunications.
IU researchers created the map using LinkedIn’s data on 500 million people between 1990 and 2015, including about 130 million job transitions between more than 4 million companies. The researchers gained access to this rare data as one of only 11 teams selected to participate in the inaugural LinkedIn Economic Graph Research program in 2015. They later became one of only two teams — IU and MIT — selected to continue their work beyond 2017. The team worked closely with LinkedIn engineers, including Michael Conover, a graduate of the IU School of Informatics, Computing and Engineering and a senior data scientist at LinkedIn at the time of the study.
“We expect this study will provide a powerful foundation for further systematic analysis of geo-industrial clusters in the context of business strategy, urban economics, regional economics and international development fields — as well as providing useful insights for policymakers and business leaders,” said Jaehyuk Park, lead author of the study and Ph.D. student at IU School of Informatics, Computing and Engineering in Bloomington.

In a blog post on LinkedIn, Park compares the study to a “roadmap” to the future economy since the first step in any journey requires understanding the current landscape.

