


Whenever UK police attend an incident or make an arrest, it is logged. This information is stored online and the largest force in the country, London’s Metropolitan Police, uses such a system to record data from its 31,000 serving officers. What’s more, all of this data is held in open formats.
Now, New York-based data science firm Dataiku has used this open data to track previous crime rates in the capital in a bid to forecast where future crimes in London will take place in 2017.
Nicolas Gakrelidz, the company’s senior data scientist who created the map, boldly tells WIRED it is possible to “predict what the crime rates might be in the future”.
The map, based on lower layer super output areas (local populations, for example) summarises how many crimes may happen in a certain area.
Each circle on the map represents a super output area, or a population, based on the number of people recorded as living in the area (between 1,000 and 3,000). The larger the circle, the more crime is predicted for the area. The largest circles, some of which can be seen near Southwark, Mayfair, and Soho, represent between 4,000 and 5,500 crimes a year.
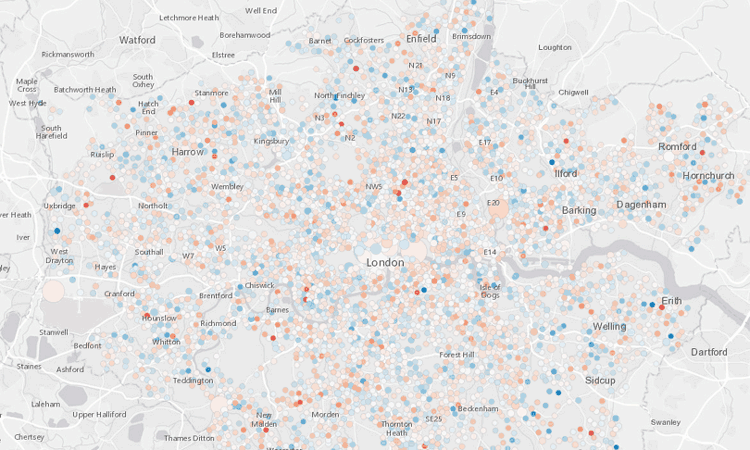
For each area, the map also shows the number of crimes predicted each month and lets comparisons happen between the 2016 figures. “If you have an area in London with a lot of shops or high criminality rates it has a high risk of having the same sort of pattern in the future,” Gakrelidz explains.
The map was built using three years of open crime data. “I decided to work with crime data from 2012 to 2015 and then predict for 2016,” Gakrelidz wrote in a detailed blog post.
After creating a prediction for 2016 it was possible to analyse the results and compare it with the real-world data from the year. “No surprise that this density map highlights the city center,” he continued.
As well as historic police data, information from the census and points of interests, such as shops and tourist attractions, were taken into account. Machine learning models were used to analyse the data and Gakrelidz said the whole predictive map “took a few hours” to create.
However, there are a few issues surrounding its accuracy. The map is largely based on historic data, which doesn’t take into account any extreme events (for example, violence at a protest of a world leader visiting the UK), or impacts on the police service.
For instance, the Met’s most senior officer has criticised cuts to police force budgets and said fewer officers will be on the streets. The impact of these cuts is not demonstrated in the trends map.
“In other words, if something significantly changes in the police strategy, law, areas, etc…the model could be really wrong,” Gakrelidz explained.
Mapping crime is not a new phenomenon. The Met and other police forces across the country produce detailed crime maps based on their own historic data. In London, it is possible to see that the areas with the most crimes are in the centre and north of the city.
Dataiku also isn’t the first to try to predict future crimes. Across the US, and in the UK predictive policing, schemes have been used for a number of years. Documents published under the UK’s Freedom of Information Act show the Met has been “actively exploring” using predictive policing and has trialed software.
The documents say the Met uses a “predictive analytical product” that it developed in-house.
Elsewhere, an app called CrimeRadar was developed to predict crime in Rio during the 2016 Olympics. The app divided the city into 250m squares and allows those who download it to see what the forecast crime rate in each square is like.
“We developed CrimeRadar to help trigger and drive a more data-driven and evidence-based debate on public security in Rio de Janeiro,” Robert Muggah, from The Igarapé Institute, which developed the app, told WIRED in 2016.
“The idea is to create a reliable source of information rather than rely on episodic news reports which contribute to a sense of hysteria. Our goal is to make what are already publicly available statistics accessible and actionable for citizens.”