
For decades, data has been presented primarily through screens. Charts, graphs, dashboards, and spreadsheets help users interpret information, but they rely almost entirely on visual perception.
Researchers at the Australian Research Centre for Interactive and Virtual Environments (IVE) at Adelaide University are exploring a different approach that allows people to physically feel data through touch and temperature.
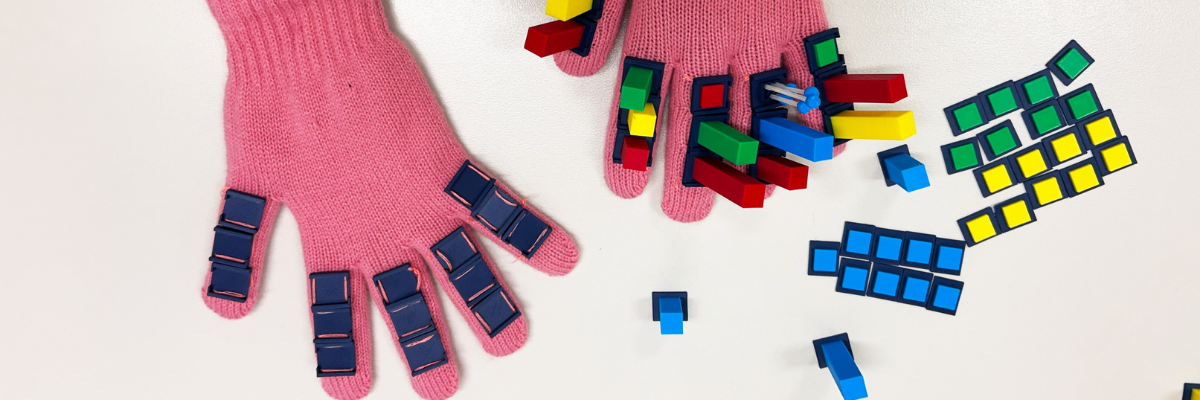
The result is an experimental wearable glove called ThermoPhy that combines data visualization with thermal feedback and physical interaction. Rather than simply displaying information on a screen, the glove transforms data into a multisensory experience that users can see, touch, and feel.
Moving Beyond Visual Data
Most modern data visualization techniques focus on presenting information visually. Whether through dashboards, smartphone apps, or computer displays, users typically interpret data through charts, graphs, and numerical values.
According to Dr. Adam Drogemuller, a lecturer at IVE, the research team wanted to investigate whether data could be experienced in a more personal and embodied way.
“Most data today is presented on screens as charts, graphs and numbers,” said Dr. Drogemuller. “We wanted to investigate whether data could be experienced in a more personal and embodied way, using physical sensations such as warmth.”
The project explores a growing area of research known as data physicalization, which seeks to represent information through physical objects and sensory experiences rather than relying solely on visual displays.
A Wearable Approach to Data Physicalization
ThermoPhy incorporates two different methods for presenting information.
The outer surface of the glove serves as a physical display. Users can attach small 3D-printed tokens that create tangible versions of familiar visualizations, including bar charts, line graphs, and heatmaps. These physical structures allow both the wearer and nearby observers to see the data being represented.
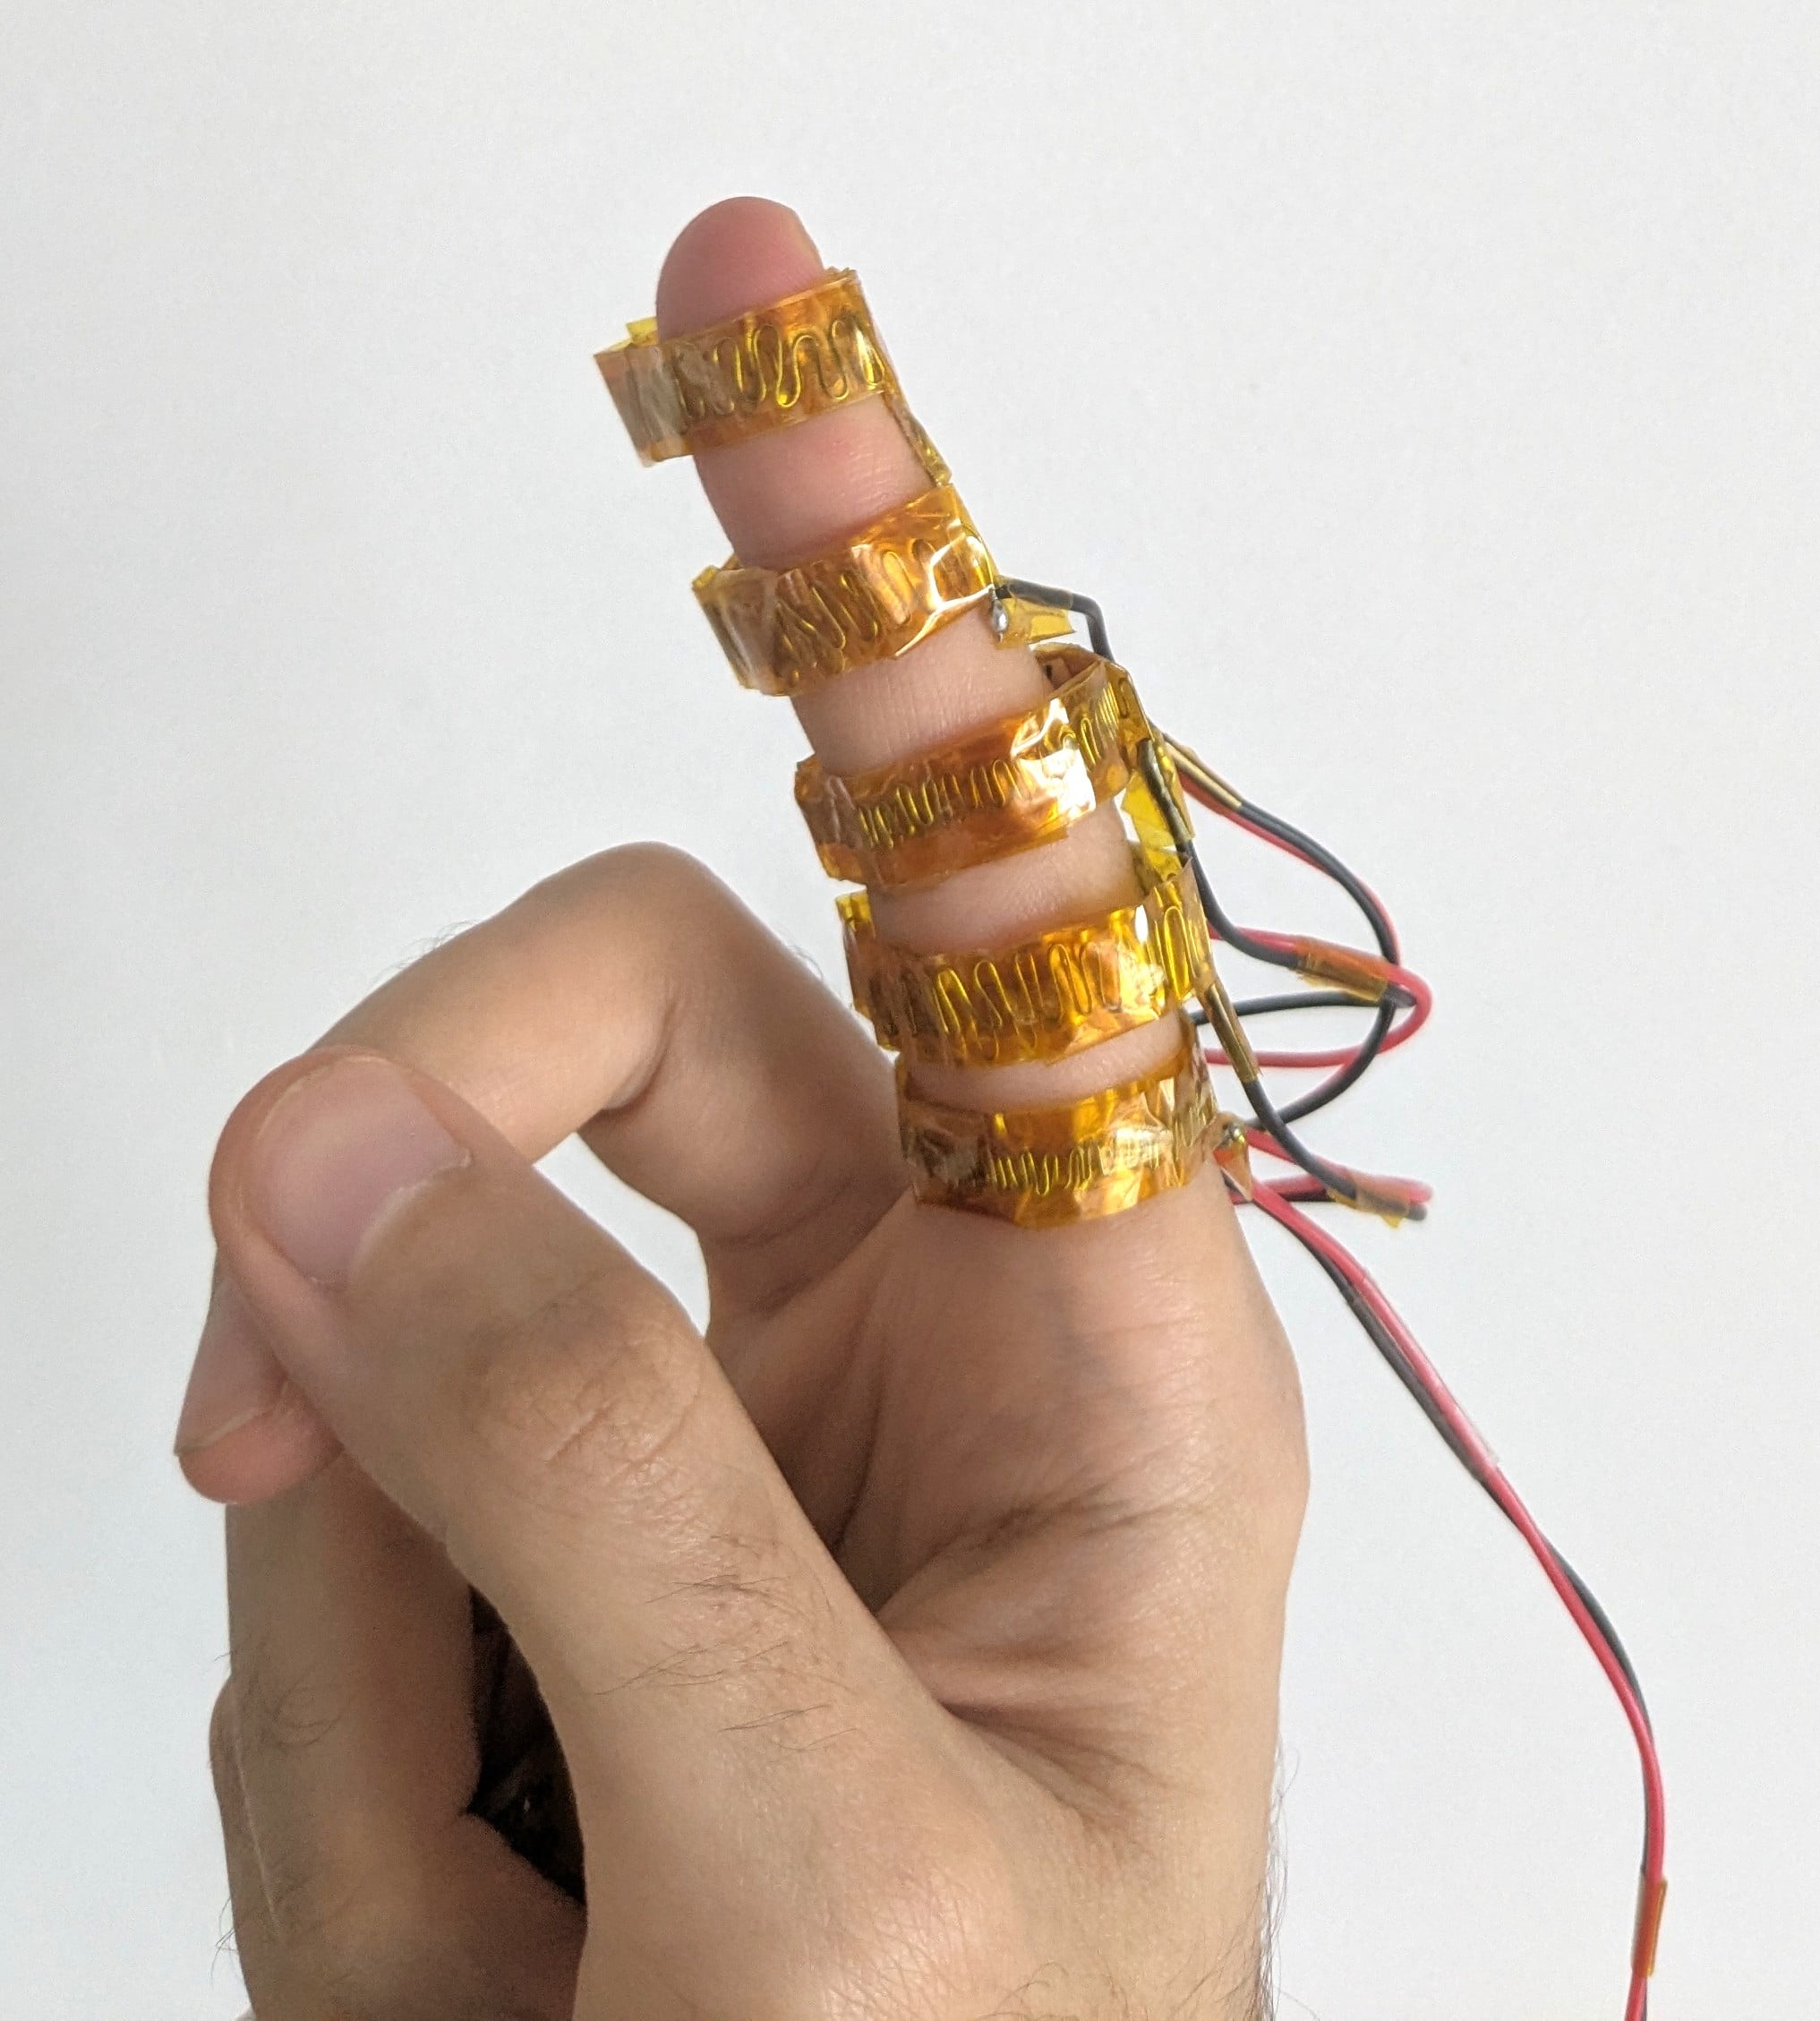
Inside the glove, tiny heating elements wrapped around the fingers generate controlled thermal sensations. These temperature changes provide a second layer of information that only the wearer can experience.
By combining physical visualization with thermal feedback, the glove creates a dual-channel interface. Public information can be communicated through visible physical structures, while more personal information can be conveyed through temperature-based feedback.
Why Use Temperature?
Temperature offers characteristics that traditional displays cannot easily replicate.
“Temperature is unique because it creates a highly personal experience,” Dr. Drogemuller explained. “Unlike information shown on a screen, thermal feedback is only perceived by the person wearing the device, making it potentially useful for representing sensitive or emotional information.”
The researchers believe thermal feedback may be particularly valuable for representing human-centered data. Metrics such as mood, stress levels, well-being, or personal experiences can be difficult to communicate through numbers alone. Temperature-based feedback introduces an emotional and physical dimension that may help users connect more directly with the information being presented.
For example, a user might represent the number of hours slept each night through physical bar-chart structures attached to the glove. At the same time, thermal feedback could communicate how the person felt upon waking. Another application might visualize workplace or classroom comfort levels, with warmer temperatures indicating greater levels of stress or discomfort.
Supporting Empathy Through Data
Beyond personal data tracking, the researchers also see opportunities for wearable data physicalization to support empathy and social understanding.
One scenario explored by the team involves a university student visualizing academic performance over several semesters. While friends or classmates could observe the physical data displayed on the glove, they could also wear the device themselves and experience thermal representations of the stress associated with those results.
This combination of visible information and physical sensation could help create a deeper understanding of another person’s experiences than traditional charts or performance metrics alone.
The concept aligns with a growing movement known as data humanism, which emphasizes the human stories and emotions that often exist behind data points.
“Data often becomes abstract and disconnected from human experiences,” said Adelaide University researcher Xiaojiao “Lily” Du. “We are interested in ways that bring people back into the process of understanding data through physical interaction, reflection and storytelling.”
An Accessible Research Platform
The researchers designed ThermoPhy with accessibility and experimentation in mind. The electronic components used in the prototype cost approximately AUD$28, making the platform relatively inexpensive to reproduce for future studies.
Low-cost development could help accelerate research into wearable data displays, allowing investigators to explore how different forms of sensory feedback influence the way users interpret information.
The project also highlights how advances in wearable electronics, additive manufacturing, and human-machine interfaces are enabling new forms of interaction that extend beyond conventional screens.
Exploring the Future of Multisensory Interfaces
Although ThermoPhy remains an early-stage research project, it points toward a broader future for wearable data visualization and multisensory user interfaces.
Future research will examine how users perceive different temperature ranges, how thermal feedback influences interpretation of information, and how wearable data physicalization could be combined with emerging technologies such as augmented reality.
As wearable devices continue to evolve, researchers are increasingly looking beyond visual displays to create richer and more intuitive interactions between people and information.
“One day, wearable technologies like ThermoPhy could help people better understand their health, emotions and personal experiences not simply by looking at data, but by feeling it,” said Dr. Drogemuller.
By combining physical objects, thermal feedback, and wearable electronics, ThermoPhy offers a glimpse into how future interfaces may transform data from something people observe into something they experience directly.